Everything you need to know about prostate cancer
Prostate Cancer > Diagnostic tools > mpMRI
The multiparametric magnetic resonance imaging
• A magnet-based technology
As MRI technology does not use X-Rays it is less invasive than a computerized tomography scan (CT scan). Instead MRI is based upon superconducting electromagnets which produce a field that causes the randomly spinning hydrogen particles (H2O being the most prominent molecule in the human body ≈ 60%) in each cells of the selected part of our body to all line up in a strong magnetic moment. However when a tissue is damaged, the atoms in that tissue remain unmatched and will not line up evenly as expected. When the magnet is turned off, the hydrogen atoms gradually return to their original position and as they do so, every hydrogen particle either in a normal or abnormal tissue emits a certain kind of energy. This energy is then detected by the a sensitive antenna, which transmits the data into the computer system in the form of signals. Finally, the computer system converts the signal into an image latter interpreted by a Radiologist. During the process of an MRI examination different sequences will be produced by the machine some of them need to be performed after a gadolinium injection which will enhance anatomical structures under certain technical conditions. Conversely to the CT scan where only transversal slides of the body are produced the MRI is able to give an image of the human body in every axis with mainly transversal [axial] (head to feet axis), sagittal (right to left axis) and coronal (front to rear axis) views.
• The sequences
For a prostate examination by mpMRI 3 sequences are needed : T2-weighted (T2W), diffusion weighted imaging (DWI) and Dynamic Contrast Enhanced (DCE). The acquisition of different sequences for the iconographic interpretation of the disease explains the multiparametric aspect of the MRI. The acquisition plan has to be the same for every sequence to be able to compare them. Usually a full mpMRI examination takes around 30-45 minutes.
-
Axial T2-weighted
The axial T2W is a morphologic sequence with a high resolution. It allows a high-resolution zonal analysis. Even if the acquisition of 3 different axis is performed during the mpMRI (axial, sagittal and coronal) more often the axial slides are mainly used for diagnosis and biopsy targeting. When normal the peripheral or anterior zone shows an hypersignal (brighter) while a cancerous lesion in the peripheral zone will rather appear as an hyposignal (darker) with blurred limits (picture 19). In the transition zone the presence of benign nodules makes the interpretation even more difficult.
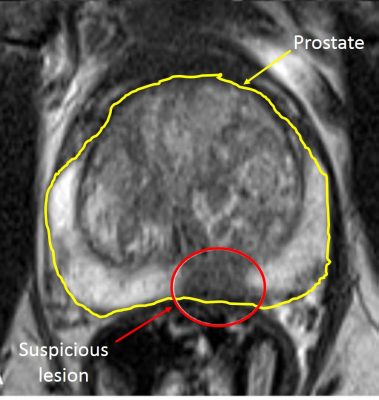
Picture 19 : Axial T2W sequence (by courtesy of Pr P De Visschere – Gent)
-
Diffusion Weighted Imaging
Conversely to T2W, the DWI is a functional sequence. In the DWI, the cancerous lesion appears as an hypersignal area compared to normal tissue which looks brihter (picture 20). Linked to the DWI sequence there is the socalled apparent diffusion coefficient (ADC) based on the calculation between at least 2 DWI sequences acquisition at different technical conditions. The interest of this last coefficient which appears as an hyposignal is based on the negative correlation between the ISUP (pathological cancer aggressivity scoring) and the ADC value.
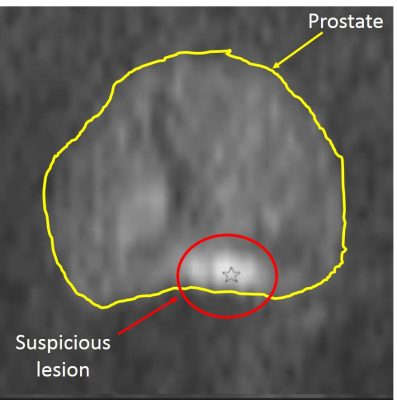
Picture 20 : DWI sequence DWI sequence (by courtesy of Pr P De Visschere – Gent)
-
Dynamic Contrast Enhanced
The DCE is performed in correlation with MRI contrast agents more often gadolinium and manganese chelates. Natural products such as blueberry and green tea have also been used for some sequences. The consecutive acquisitions allow to highlight early contrast enhancement in suspicious lesions due to the neo-angiogenesis (new abnormal vessels). Prostate cancer lesions appear as an early hypersignal compared to the surrounding tissue (picture 21). Here again the interpretation of the images is easier in the « homogeneous » peripheral zone than in the adenomatous transitional zone. No enhancement does not exclude definitely the presence of cancer and more generally a DCE sequence should always be interpreted with concomitant T2W and DWI sequence. Indeed no DCE contrast enhancement showing a cancerous lesion will not be confirmed by an abnormal T2W and/or DWI abnormal sequences.
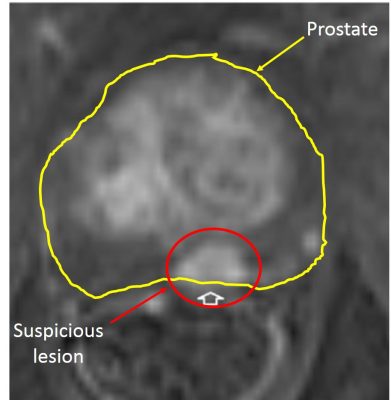
Picture 21 : DCE sequence (by courtesy of Pr P De Visschere – Gent)
• PIRADS classification
Based on the BI-RADS (Breast Imaging and Reporting Archiving Data System), The European Society of Urogenital Radiology (ESUR) developed a consensus-based guidelines for prostate mpMRI the PI-RADS. Depending on the location of the lesion peripheral or transitional the calculation of the PI-RADS score is different. The classification goes from 1 to 5 with 1 being the absence of lesion and 5 a highly suspicious lesion (Figure 2 and picture 22). In 2014, an update of the first version of the PI-RADS score has led to the PI-RADS v2. The more aggressive is the disease (higher ISUP score), the better is the detection rate even for small volume lesions (table 4).
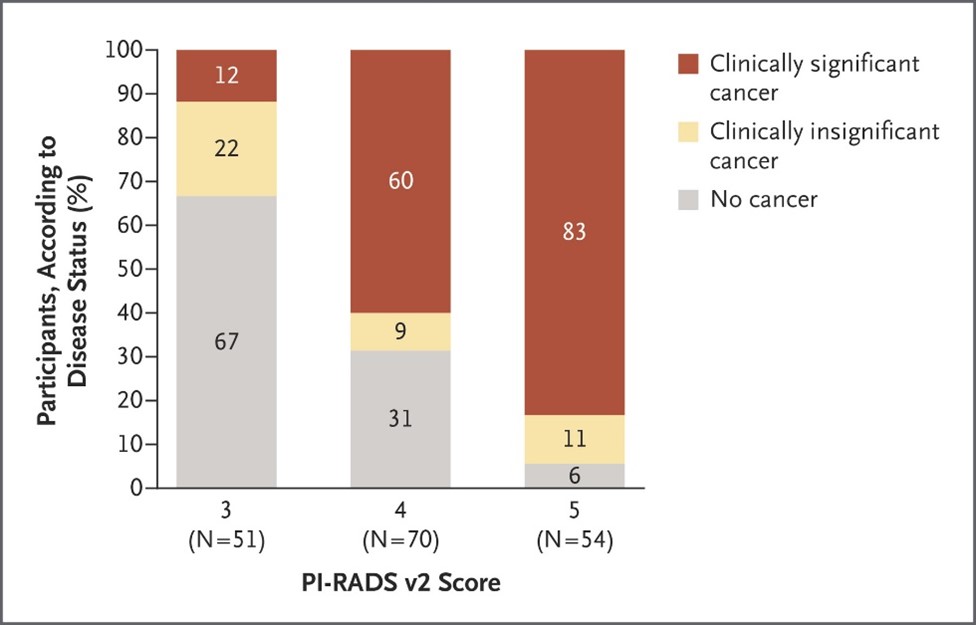
Figure 2 : Risk of prostatic cancer depending on the PI-RADS v2 score (source : EAU guidelines)
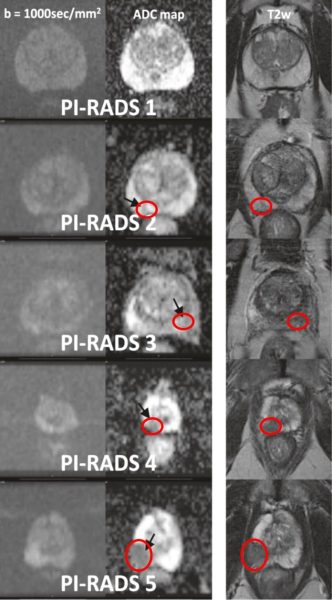
Picture 22 : PIRADS 1 to 5 categories (by courtesy of Dr P. Steiger – Klinik Beau-Site)
Through the past years the detection of prostate cancer by mpMRI has consistently increased (table 4) and the technological improvement such as the use of more powerful superconducting electromagnets allowing to move from a 1.5 to a 3 Tesla (3T) MRI proves that the technology will undoubtely overcome any present difficulty to detect even the smallest cancer with a frightening accuracy. In some centers a 7T MRI which gives for instance incredible high-quality cerebral pictures is already in use while a 10.5T MRI is evaluated in the research domain (picture 23).
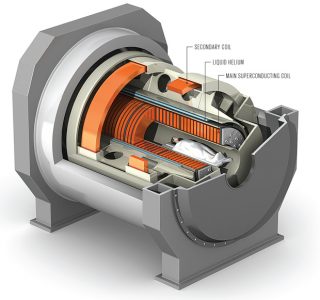
Picture 23 : A superconducting magnet with a spatial resolution of about 0.1 mm compared to 1 mm today

Table 4 : Prostate cancer detection rates by mpMRI based on tumour volume and ISUP classification (source : EAU guidelines 2020)


